Surfer

Call for price

In stock

Visualize Data

You work hard gathering your data. Don’t settle for subpar visualizations.
Utilize Surfer’s extensive modelling tools to display your data the way it deserves while maintaining accuracy and precision.
Clearly communicate information related to geology, hydrology, environment, construction and more with Surfer.

Compare

Create Professional Maps for Your Field

Easily communicate both simple and complex spatial data. Whether your work pertains to geology, hydrology, construction, the environment or any related industry, Surfer gives you the tools to create high-quality maps to clearly deliver your message to coworkers, clients, and stakeholders alike.


Surfer Map Types

  • Contour
  • Base
  • Post
  • 3D Surface
  • Color Relief
  • Classed Post
  • 3D Wireframe
  • Point Cloud
  • Drillhole
  • Peaks and Depressions
  • 1-Grid Vector
  • 2-Grid Vector
  • Watershed
  • Grid Value
  • Viewshed
Surfer 2D & 3D Modeling and Analysis Software: Contour map of temparature at 200 meters

Image courtesy of Igor Yashayaev, Bedrod Institute of Oceanography, Canada


Surfer 2D & 3D Modeling and Analysis Software: View all aspects of point data in true 3D space
Surfer 2D & 3D Modeling and Analysis Software: Grid true 3D XYZC data to visualize contamination, mineralization, seismic refraction velocity, temperature distribution, or dissolved oxygen concentration.

Interpolate and visualize 3D data, such as subsurface soil or groundwater contamination, mineralization concentration, seismic refraction velocity, temperature distribution, or dissolved oxygen concentration.


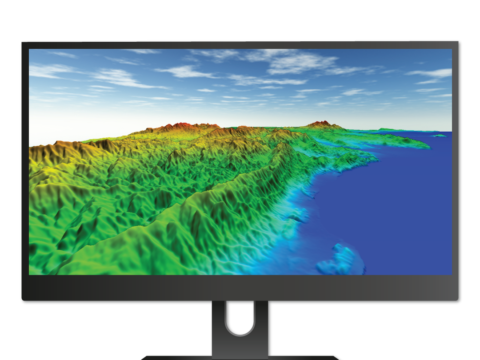
Model Data in Multi-Dimensions

Gain deeper insights into your data by viewing in three-dimensional space. Surfer’s 3D viewer makes it easy to model, analyze, and understand all aspects of your data. Switching between Surfer’s 2D and 3D perspectives ensures you discover all of your data’s patterns and trends.


Achieve a 360⁰ Perspective

  • View point data, 3D polylines, 3D polygons, 3D polymeshes, and surfaces in true 3D space
  • Visualize 3D grids as a volume rendering or isosurface
  • Visualize drillhole data as points, intervals and paths
  • Digitize point locations and obtain XYZ coordinates
  • Rotate your map
  • Walk along the surface
  • Adjust the vertical exaggeration
  • Add X, Y or Z axes to gain a frame of reference
  • Create a color scale bar
  • Note the X, Y or Z position of the cursor in the status bar
  • Create and record fly-through videos to share with others
  • Export the model to a 3D PDF or VRML file
  • Export the model to an image file, like JPG, TIF or PNG
  • Copy the display and paste it into reports and presentations

Streamlined Workflows

You will be up and running in matter of minutes. Surfer’s user interface was designed to take the guesswork out of learning a new program for users in any industry, from hydrology to construction. We worked hard to streamline workflows so you don’t have to.


Surfer User Interface Features

  • Welcome dialog to get you started
  • Map wizard to quickly create maps and models
  • Customize ribbon and quick access toolbar
  • Dock or float all windows
  • Single window to view, edit, and manipulate the data and maps
  • Contents window to easily manage layers of maps and models
  • Properties window for quick feature editing
  • Worksheet window to view or edit raw data
Surfer 2D & 3D mapping, modeling & analysis software: Surfer
Surfer 2D & 3D mapping, modeling and analysis software: Color map of elevation with a profile map

Enhance Maps & Models

Surfer gives you the tools to visualize and model all types of data, but it doesn’t stop there. Surfer’s extensive customization options allow you to convey complex ideas in an easy to understand manner, whether applying for a grant, presenting to a class or sharing your findings with industry peers. Enhance your maps and models with a variety of customization options.


Surfer Customization Options

  • Add legends, cross sections, magnifiers, scale bars, and multiple axes
  • Include headers and footers
  • Apply linear or logarithmic color scales
  • Adjust tilt, rotation, and field of view angle
  • Edit all axis parameters
  • Include graticule lines or another grid
  • Combine or stack multiple maps
  • Define custom line styles and colors
  • Edit text, line, fill and symbol properties
  • Add text, polylines, polygons, symbols, and spline polylines
  • Adjust individual labels anywhere you wish
  • Include range rings
  • Many more…

Grid Data with Certainty

Have complete confidence in the accuracy of your model. Surfer provides numerous interpolation methods to grid regularly or irregularly spaced data onto a grid or raster, and each interpolation method provides complete control over gridding parameters. Plus, no time is wasted with multithreaded gridding!


Surfer Gridding Methods

  • Kriging
  • CoKriging
  • Inverse Distance
  • Minimum Curvature
  • Natural Neighbor
  • Triangulation with Linear Interpolation
  • Nearest Neighbor
  • Local Polynomial
  • Polynomial Regression
  • Data Metrics
  • Radial Basis Function
  • Modified Shepard’s Method
  • Moving Average

Surfer Interpolation Features

  • 3D XYZC gridding
  • Variogram models
  • Anisotropy
  • Kriging with external drift
  • Faults and breaklines
  • Control over search neighborhood size, shape, and constraints
  • Data filtering
  • Create grid files directly from contour polylines
  • Grid to convex hull
  • Duplicate handling
  • Cross validation
  • Control over output geometry and resolution
  • Automatic data statistics
  • Limit or clamp z-values
Surfer 2D & 3D mapping, modeling and analysis software: Contour and post map of earthquake magnitudes greater than 2.5
Surfer 2D & 3D mapping, modeling, and analysis software: Interpolating airborne geophysical survey data is straightforward with Surfer
Surfer 2D & 3D mapping, modeling, and analysis software: Use the extensive grid options to create detailed and informative maps

Full Grid Control

Surfer gives you extensive control over grid files. Create isopach maps for structural geology, calculate volumes for inventory management or derivatives for terrain analysis, and even create site suitability models all with grid files. Achieve a complete understanding of your underlying data.


Surfer Grid Features

  • Directly edit the underlying grid data
  • Calculate volume and area of grids
  • Create isopach and isochore grids
  • Add, subtract, multiply, and divide grids
  • Perform custom mathematical functions on grids
  • Calculate differential and integral operations or Fourier and spectral analysis
  • Convert areas to nodata
  • Project grids from one coordinate system to another
  • Mosaic multiple grids together seamlessly
  • Transform, offset, rescale, rotate, or mirror grids
  • Filter grids with high- and low-pass filters
  • Extract smaller areas from a grid
  • Subtract the Z in the grid from the original Z
  • Calculate the volume and areas between contours

Edit Grids or Rasters

You are the expert on your area of study and as you know, the data doesn’t always match what is in the field.

Surfer’s grid editor lets you quickly adjust contour lines by interactively editing the underlying grid file. Display point data or base layers in the grid editor for context, so you know exactly where and how to edit your grids. Brush, warp, smooth, push down or up, and erase grid nodes, and immediately see the changes to your grid-based maps.

Surfer makes it super easy to align the data with reality!


  • Perform free-hand contour editing
  • Brush specific Z values across nodes
  • Smooth contours
  • Pull up or push down contours in specific areas
  • Warp contour lines
  • Erase parts of the contour map
  • Find the Z value at any XY point location
Surfer 2D & 3D mapping, modeling, and analysis software: Interactively edit contour lines with the grid editor
Surfer 2D & 3D mapping, modeling, and analysis software: Surfer offers many geoprocessing tools including buffers
Surfer 2D & 3D mapping, modelying, and analysis software: Apply symbology based on attribute values

Make Meaningful Decisions

Get answers to your questions with Surfer’s geoprocessing tools. Process your data and analyze relationships. Narrow down areas of interest, highlight important intersections, or perform mathematical calculations on the underlying data to make informed decisions.


Surfer Geoprocessing Tools

  • Convert the coordinates of vector files
  • View, create, edit and delete object attributes using the convenient Attribute Table
  • Calculate attribute values
  • Query objects based on attribute values
  • Perform Delaunay triangulation
  • Reshape, simplify, smooth polylines, polygons, and grids
  • Create polygons tightly around data points
  • Apply buffers around points, polylines, and polygons
  • Convert between polygons and polylines
  • Create polygons by combining existing polygons
  • Create points or polygons in intersecting areas
  • Connect or break polylines at specified locations
  • Combine and split islands
  • Automatically disperse labels so they don’t overlap
  • Georeference images
  • Crop images
  • Set a color in an image to be transparent

Surfer Symbology

  • Apply line, fill, and symbol properties based on attribute values
  • Display symbology in the legend
  • Select symbology based on unique values, unclassed colors and symbols, classed colors and symbols, and pie charts
  • Display proportions of various components with pie charts

Work Seamlessly with all Coordinate Systems

Your job is to transform data into valuable visualizations. Surfer’s job is to make it easy for you. Surfer effortlessly manages unreferenced data and data in different/multiple coordinate systems. It really is that easy.


Surfer Coordinate System Features

  • Over 2500 predefined coordinate systems
  • Create custom coordinate systems
  • Search coordinate systems by name or EPSG number
  • Reproject coordinate systems
  • Over 80 ellipsoids
  • Over 45 predefined linear units
  • Create custom linear units
  • Add graticule or grid lines to view different coordinate systems on a map
Surfer 2D & 3D mapping, modeling, and analysis software: Pine beetle infestation map created with 10 different data sets in 5 different coordinate systems

Image courtesy of Eric Dickenson, Environmental Science and Engineering Division, Colorado School of Mines.


Surfer 2D & 3D mapping, modeling, and analysis software: Download maps and grids from any web mapping service

Immediate Access to Online Data

An abundance of data is at your fingertips waiting to be visualized. Surfer gives you immediate access to worldwide aerial imagery, Open Street Map imagery, worldwide vector data, and terrain data. If you have your own favorite data servers or access to a private data server, include a custom link to that source for easy access. Surfer makes it easy to access the surplus of online data.

Supported server types:

  • Web mapping server (WMS)
  • Open Street Map server (OSM)
  • Web coverage server (WCS)
  • Web feature server (WFS)


Complete Compatibility

Seamlessly visualize and analyze data from multiple sources for multiple industries. Surfer natively reads numerous file formats including SHP, DXF, LAS/LAZ, and XLSX. Surfer also supports all popular export formats. An extensive set of data management tools are at your disposal for complete compatibility.


Surfer 2D & 3D mapping, modeling, and analysis software: Surfer offers complete compatibility with all popular formatsfile
Surfer 2D & 3D mapping, modeling and analysis software: Easily share your work with colleages, clients, and stakeholders

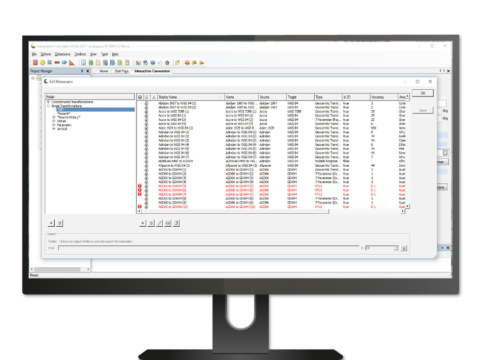
PDF snippet courtesy of Alecos Demetriades, Institute of Geology and Mineral Exploration.
Demetriades, A., 2011. The Lavrion urban geochemistry study, Hellas. Chapter 25 In: C.C. Johnson, A. Demetriades, J. Locutura & R.T. Ottesen (Editors), Mapping the chemical environment of urban areas. Wiley-Blackwell, John Wiley & Sons Ltd., Chichester, U.K., 424-456.


Collaborate with Confidence

Quickly share your work with colleagues, stakeholders, and clients in geology, hydrology, construction and beyond. Surfer models are ready for printed publication with the high quality export formats including PDF, 3D PDF, or TIF. Alternatively, share your work online with web compatible formats like JPG or PNG. If you are preparing for a presentation, simply copy and paste your map or model into presentation tools such as Microsoft PowerPoint or Word.


Work Smart, Not Hard with Automation

Don’t waste time doing the same process over and over. Create scripts to automate repetitive or recurring tasks. Surfer can be called from any automation-compatible programming languages such as C , Python, or Perl. Surfer also ships with Scripter, a built-in Visual Basic compatible scripting tool.

Save time with automation, and save even more time by reviewing the extensive set of sample scripts in the Surfer Automation Knowledge Base!


Surfer 2D & 3D mapping, modeling and analysis software: Streamline workflows with built-in automation


Be the first to review “Surfer”

Your email address will not be published. Required fields are marked *

Reviews

There are no reviews yet.

See It Styled On Instagram

    No access token
×


Main Menu

Call for price

Add to Cart