How to Turn Complex Data into Clear Stories With Surfer & Grapher by Golden Software
Sincerely, data is only powerful if people can understand it, and Surfer and Grapher simplify it.
Even if you have the most precise sets of data in the world, hiding them in spreadsheets or spreading them across different reports will make them lose their impact. This is why tools such as Surfer and Grapher are very helpful.
These are not simply pieces of software but rather interpreters who understand complex and technical data and generate visuals that people can understand.
What Exactly Are Surfer & Grapher?
Both tools are created by Golden Software, and their main goal is to support professionals in analyzing, visualizing, and communicating data effectively. Surfer is about 2D and 3D geospatial modeling, whereas Grapher is all about producing high-quality graphs and data visualization.
Together, surfer and grapher make a very capable set of tools for those dealing with data that has to be visualized rather than just stored. You may not even realize how important these tools are. For instance, if you try to describe groundwater flow, environmental changes, or engineering data through just numbers, it is very difficult. Compared to showing it as a 3D model, contour map, or an interactive graph.
That’s the difference.
Surfer and Grapher help bridge the gap between:
- Data and decision-making
- Technical experts and non-technical stakeholders
- Raw numbers and real-world insights
And that’s exactly why they’re used globally.
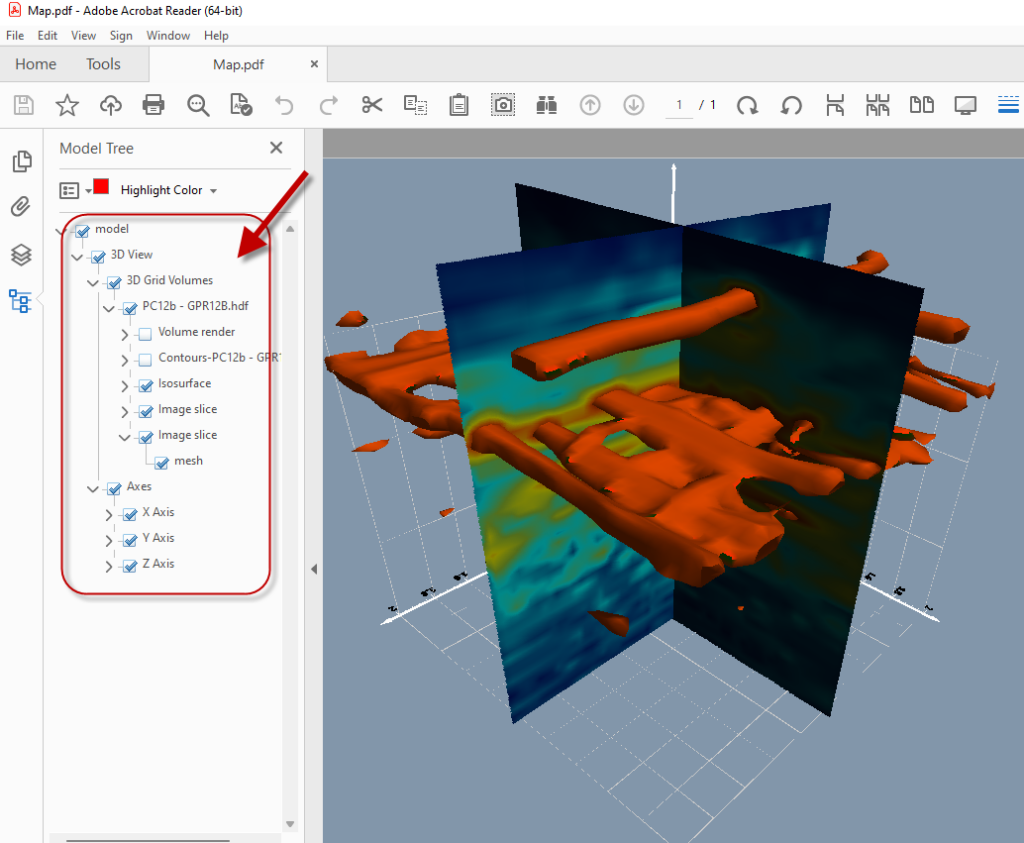
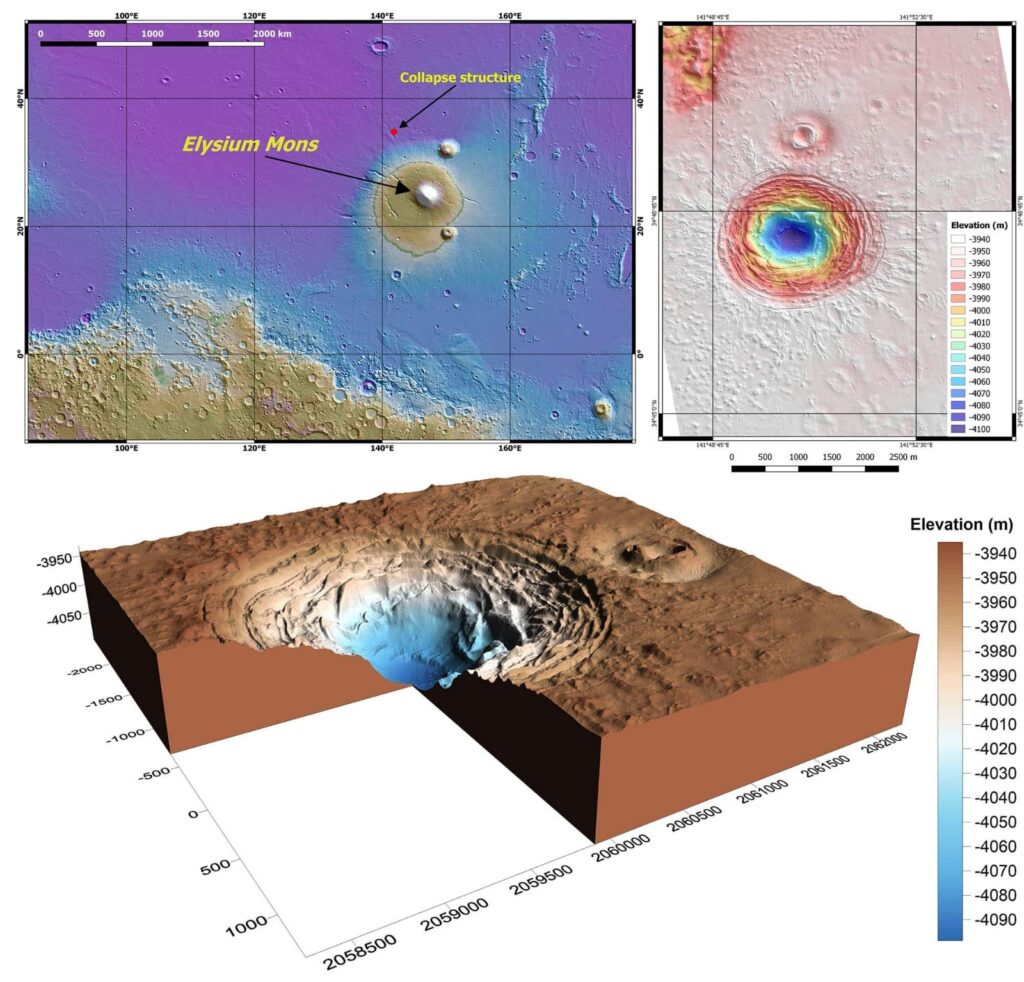
Surfer: Where Data Becomes a Landscape
Surfer is built for mapping and modeling complex spatial data.
With it, you can:
- Create detailed 2D and 3D surface models
- Generate contour maps, terrain models, and subsurface visuals
- Analyze patterns like groundwater flow, contamination, and elevation
It supports various interpolation methods (such as Kriging and triangulation) for converting raw data into precise grid and surface representations. Besides that, one may convert data to satellite images or export the models in formats like Google Earth and AutoCAD. Simply put, Surfer enables you to visualize your data.
Grapher: Turning Numbers into Narratives
While Surfer maps the world, Grapher tells the story behind the numbers.
Grapher allows you to:
- Create over 70 different graph types—from simple charts to complex 3D plots
- Import data from multiple sources and export to formats like PDF and PNG
- Customize every detail for professional presentations
- Apply statistical analysis, fit curves, and error bars
What makes it special is how easily it turns raw datasets into clear, compelling visuals—even for non-technical audiences.
What makes it special is how easily it turns raw datasets into clear, compelling visuals—even for non-technical audiences.
Who Uses These Tools?
These instruments are very common in various sectors where data is paramount.
Engineers rely on them for examining landforms, building-related data, and site situations. Geologists and environmental scientists utilize them for mapping the distribution of soil, water, and pollution. Researchers and academics use them for publishing data-supported papers and studies. Business analysts use them for showing changes, predictions, and gaining deep understanding.
Actually, Surfer by itself is a tool used by over 100,000 scientists and engineers across the globe.
There are plenty of tools out there, but Surfer and Grapher stand out because they:
- Combine power with ease of use
- Offer automation to save time and reduce errors
- Support high-quality, publication-ready outputs
- Help communicate insights clearly to any audience
They’re not just technical tools; they’re communication tools.
Surfer and grapher are smart investments if used right.
Like any powerful software, the value you get depends on:
- Proper setup
- Correct configuration
- Understanding how to apply it to your specific needs
That’s why having the right support matters.
At OAS Technologies, we assist both individual professionals and organizations in fully exploiting the capabilities of software such as Surfer and Grapher. We provide users with direct access to authentic Golden Software products, industry-specific installation, hardware setup, and continuous support all at affordable pricing that fits your budget.
We help engineers, researchers, or business professionals convert data into a powerful and meaningful visual. Don’t let useful data remain hidden in your spreadsheet.
Contact OAS Technologies now to find out how Surfer and Grapher can transform the way you work with data.
Send us a message, ask for a quote, and let’s bring your data to life.